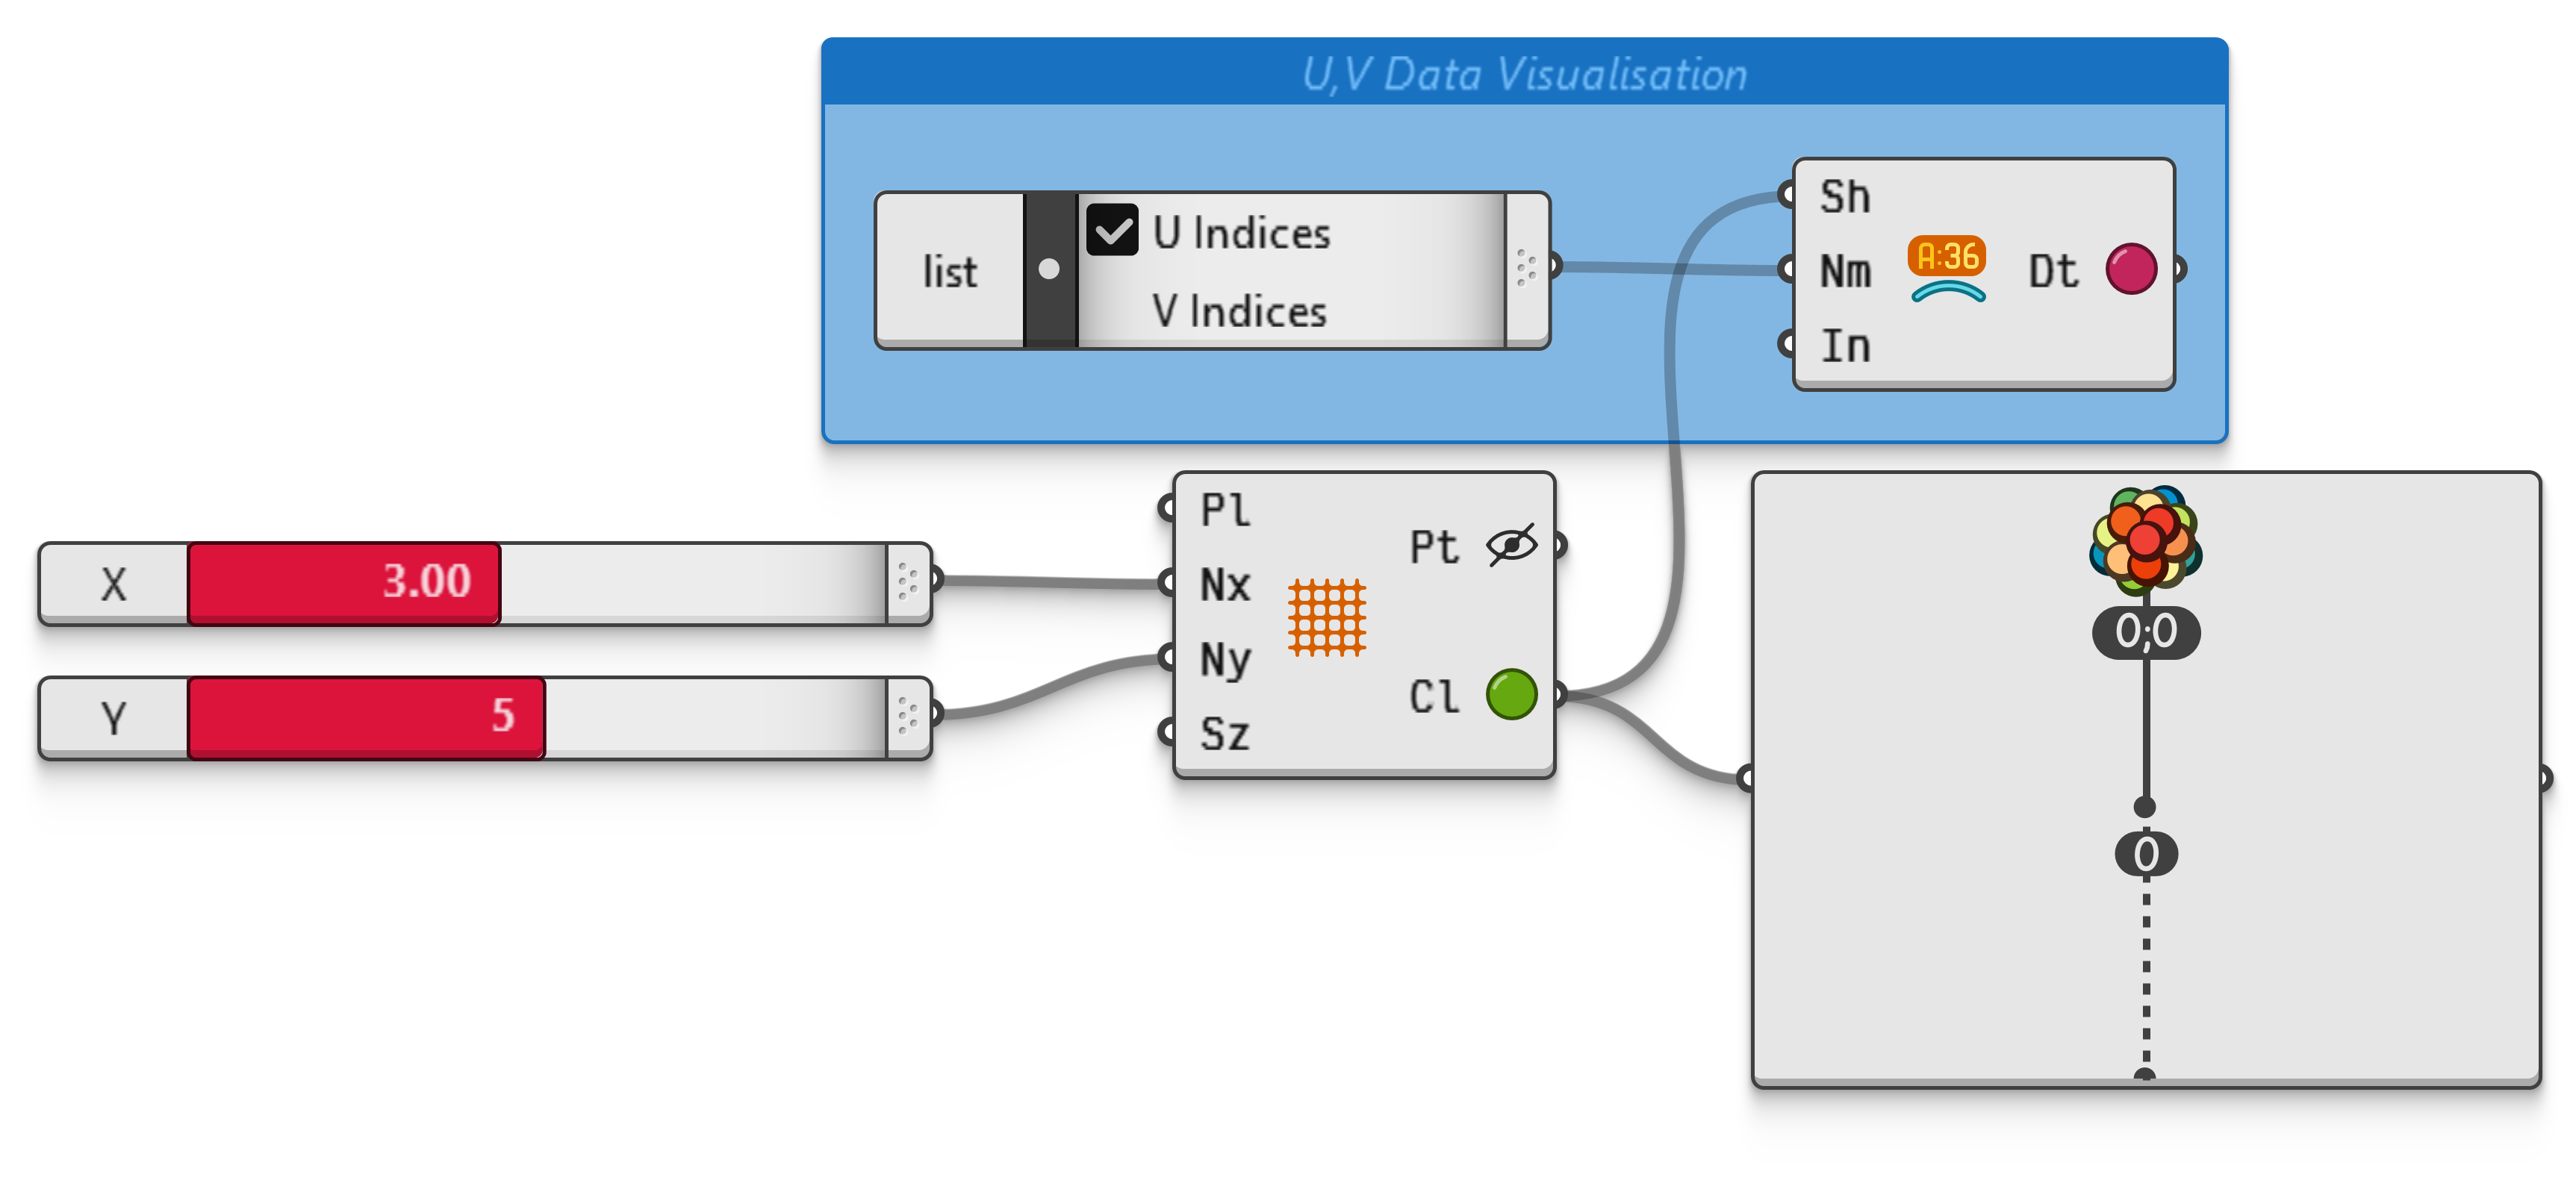
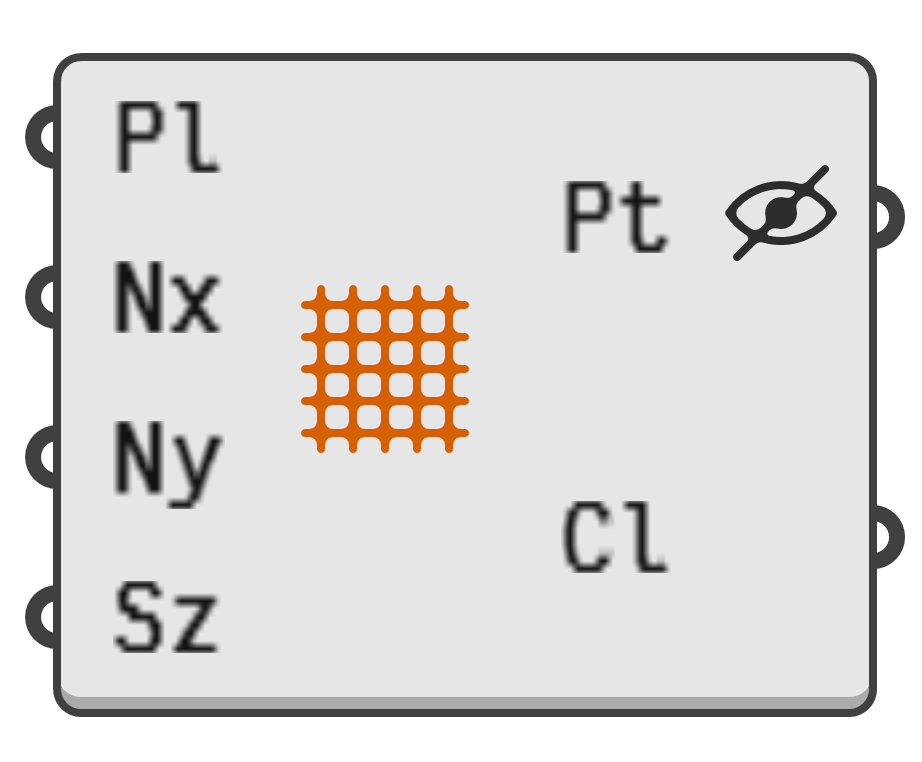
Create a repeating grid of stacked square cells, along with their vertices. The extent of the grid in the X and Y directions is determined by two numeric intervals, with negative numbers indicating grid cells to the left of the y-axis and below the x-axis.
If these intervals start and end at whole numbers, all rows and columns in the resulting grid will be exactly the given size. However, if the intervals start or end at fractional numbers, the first or last row or column will be smaller. For example, if the X interval ends at 5.6, the width of the rightmost column will be only 60% of the given size.
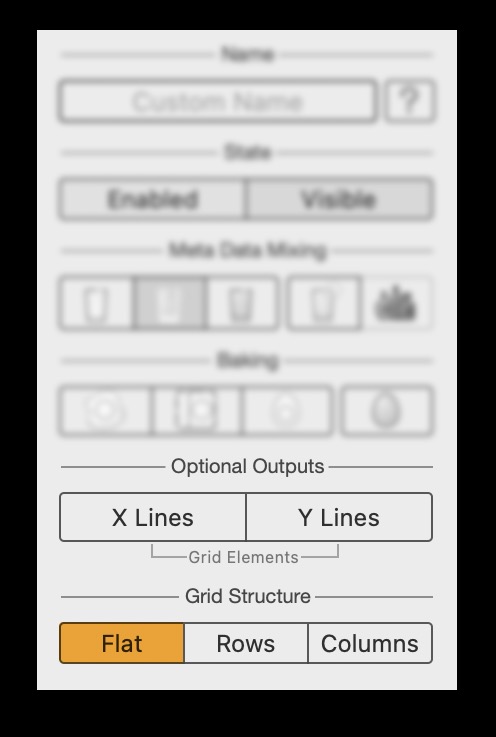
Most grid components, including this one, offer additional options in the component menu affecting the inclusion (1) and structuring (2) of output data, as per figure 1.
- The
X LinesandY Linestoggles will show or hide the outputs containing the lines between columns and rows. These line outputs are hidden by default, with only the rectangular boundary curves of each individual cell being shown in theCloutput. - The
Flat,Rows, andColumnstoggles affect the data structure of the cells and vertices. More on this in the Advanced Content section.
This component can organise rectilinear grids in three different ways, providing a balance between simplicity and specificity:
- Flat (default)
- Row-based
- Column-based
In flat mode, all the grid cells and vertices are grouped in single lists. This is the simplest data structure, especially when a single component is used to create more than one grid. Each list in the output tree contains all the vertices and boundaries that make up a single grid.
Conversely, the row and column modes group all the vertices and cells belonging to the same row, or column, within a grid into individual lists. This allows for more structured access downstream.
Do note that all grid elements are tagged with meta data which allow each vertex, cell and line to be uniquely identified based on their row and column indices. The column and row indices of each element are stored under U and V meta data respectively.