
Field Bar Display
00000000-7006-4c99-8357-81a3bc1f5304
This page was generated from the component’s built-in descriptions. An in-depth article has not been written for it yet.
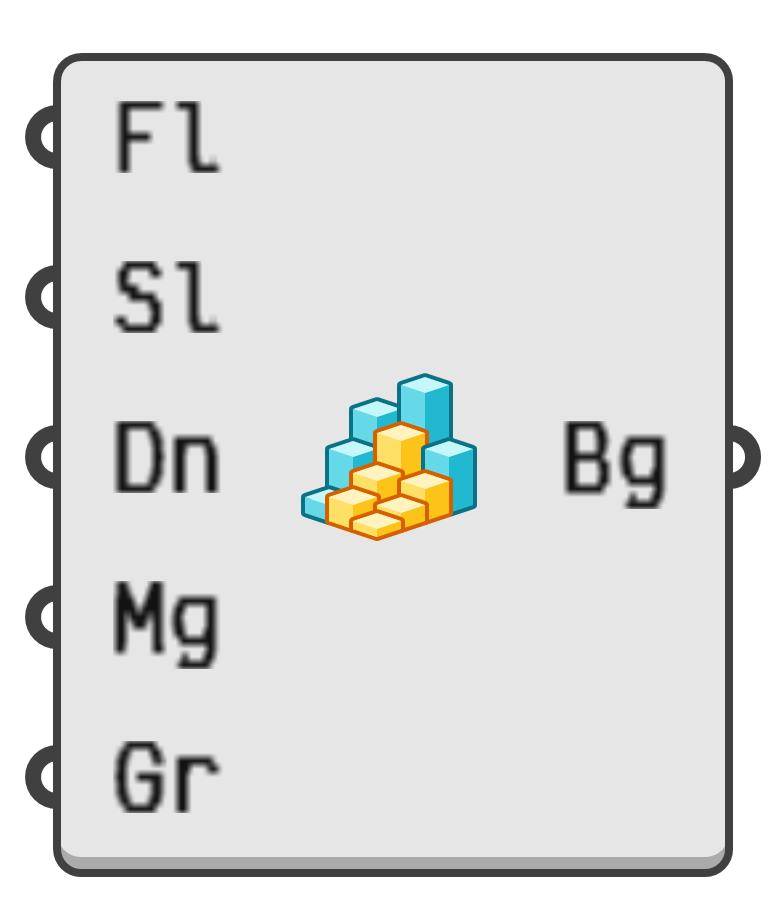
Display a sampling of field values as a two-dimensional bar graph.
- Fl → Field to sample.
- Sl → Boundary of bar graph.
- Dn → Number of samples per slice.
- Mg → Optional function mapping the sampled values to bar heights.
- Gr → Optional gradient mapping the sampled values to bar colours.
- Bg → Bar graph mesh.