
Density Bar Graph
00000000-55e8-47a0-9972-e5ac3dcd4fc2
This page was generated from the component’s built-in descriptions. An in-depth article has not been written for it yet.
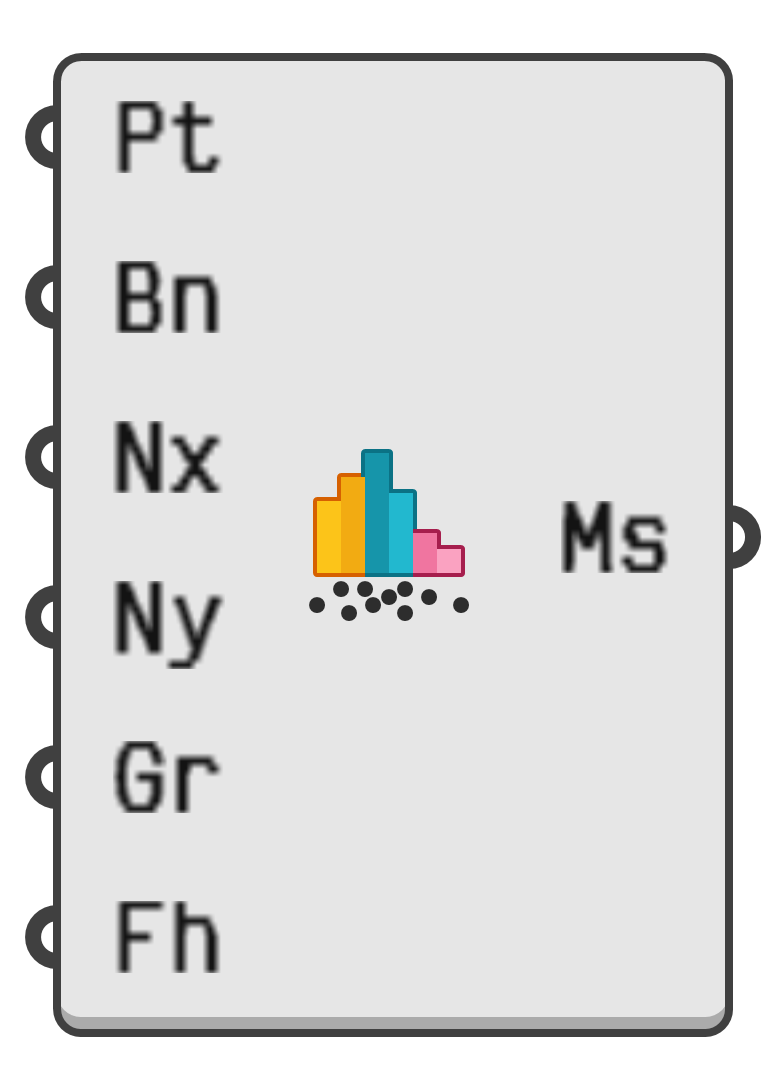
Create a 3D bar graph in the viewport, representing the density of points underneath each bar.
- Pt → Points to sample.
- Bn → Outer boundary of the entire bar graph.
- Nx → Number of bars along the graph x-axis, or the approximate total number of bars if Ny is not set.
- Ny → Optional number of bars along the graph y-axis. If omitted, the Nx value controls the total number of bars.
- Gr → Optional gradient which maps bar valence to bar colour.
- Fh → Optional function which bar valence to bar height.
- Ms → Mesh representing the 3D bar graph.