 GlobalEdgeContinuity
offers a concise overview of your model’s surface continuity with both visual and numerical feedback. You can easily detect surface edges that need attention. Edit and verify until your edges meet in G0, G1, or G2 accurately.
GlobalEdgeContinuity
offers a concise overview of your model’s surface continuity with both visual and numerical feedback. You can easily detect surface edges that need attention. Edit and verify until your edges meet in G0, G1, or G2 accurately.
Interactive User Interface
- A dialog coupled with in-viewport tools for visual feedback.
- Select an edge pair in-viewport or in the dialog to show the deviation details of that edge pair.
- Select multiple edge pairs to show their maximum deviation, both in-viewport and in the dialog.
- Sort Edge pairs on highest deviation for G0, G1 and G2 by clicking the column header in the dialog.
- Set a zoom level and automatically zoom to that edge when selecting.
- Controlpoint massage a surface and see the deviation update in real time.
- Analyze edges on-surface.
Limitations of EdgeContinuity in Rhino 8
GEC is a complete analysis tool for surface continuity. Most models are composed of multiple surfaces, and these surfaces must meet within a certain tolerance and at a specific angle to define their accuracy and shape. The existing  EdgeContinuity
command can only handle 2 edges at a time. With GlobalEdgeContinuity
you can:
EdgeContinuity
command can only handle 2 edges at a time. With GlobalEdgeContinuity
you can:
- Analyze more than two pairs.
- Analyze a single edge against multiple ones.
Try It
- Download Rhino 9 WIP for Windows or Mac.
- Download and open GEC-tryit.
- Run the GlobalEdgeContinuity
command.
- Window select all surfaces and press .
- Rhino immediately calculates the edge continuity between the selected surfaces and displays the results in the Global Edge Continuity dialog.
- Edges that are G0 continuous will be marked gray.
- Select the button in the dialog.
- Notice that some edges turn blue, indicating that these are tangency continuous.
- Select the button in the dialog.
- Notice that some edges turn white, indicating that these are curvature continuous.
- Turn on
Show Filtered G1 and G2 edges. When this option is on, edge pairs that exceed the Evaluation Settings Filter G1 and G2 values will not be displayed. - Select the label in the viewport with number 6.
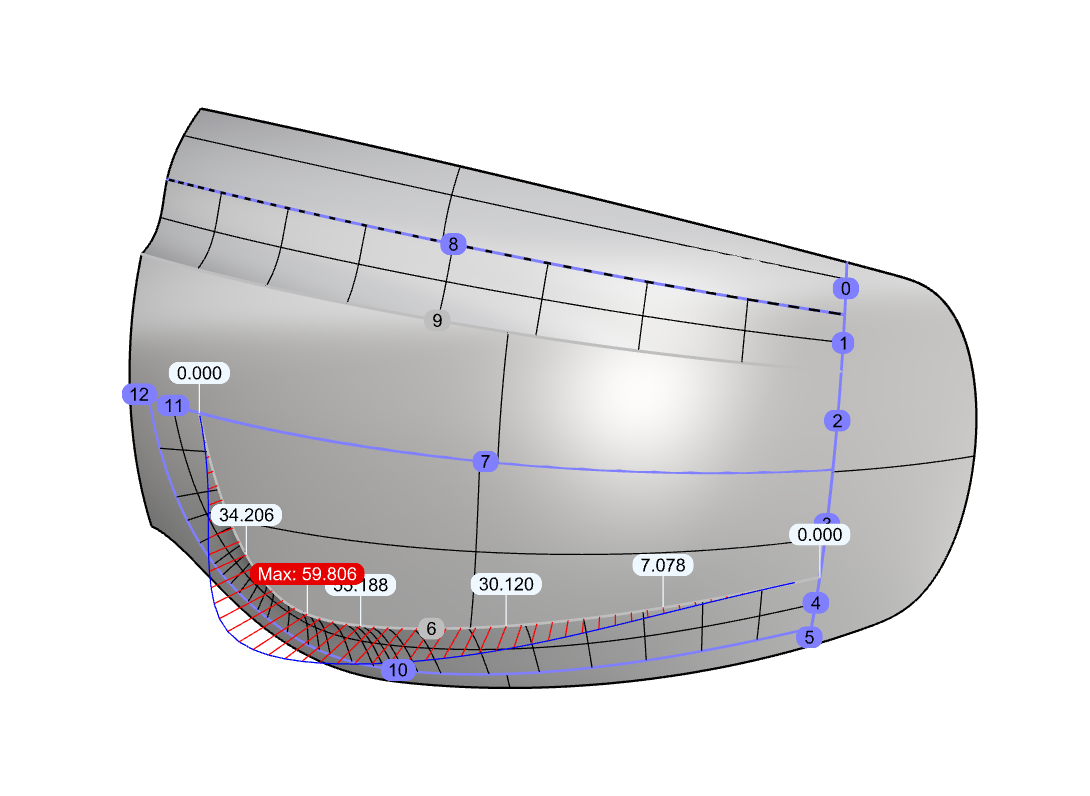
- Notice that this edge gets focus and displays a graph and deviation information in the viewport.
- Try this on your own surfaces.
- Please ask questions and give feedback on the Discourse Forum.