Grouping and Filtering
Have you ever wanted more granularity over the data or objects inside of Grasshopper? For example, have you ever wanted to select only the objects in your model that have a particular material applied to them (i.e. glass)? Or maybe you wanted to remove all surfaces in your model that were on a specific layer and whose area was smaller than a certain value. Could you do it (easily)?
Grasshopper 1 for Rhino 8 has new components which will help you manage your data more effectively.
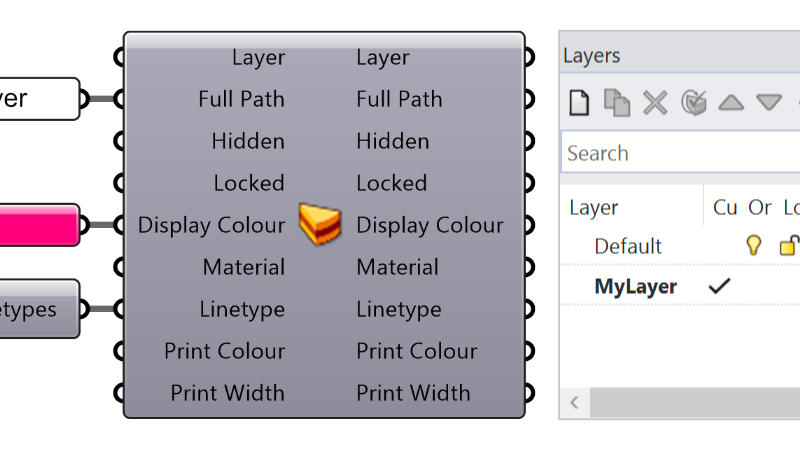
To explain how these new components work, it is best to start with a simple example. In this massing model there are BREPs representing the outside envelope of the buildings and surfaces which serve as the floors. The objects have been placed on different layers and have been assigned different colors based on their use type (office, residential, etc.).

Most of the objects also have some meta data attached to them as user text entries. You can find this data by selecting an object in the model and the opening the Object Properties panel. At the top of this panel, you should see several icons. Click on the one labeled Attribute User Text.

Let’s begin this tutorial by figuring out the overall area of each building in our massing model. We have three building masses in our model. Each of the floor plates have a Building ID number assigned to them as a user text entry.

Grouping Content
To get started, Let’s open the Grasshopper editor and click on File -> New Document to start a new definition.
To find the overall floor area of each building, we need to first reference all of the floors in our Rhino model into our Grasshopper definition.
This tutorial is all about filtering data. Since we organized our model by layers, we can filter for the floors by using the Layer input of the Query Model Objects component (found under the Rhino tab and Object subcategory). By using the “*” wildcard after the word Floors, it will select all the objects on the Floors sublayers.

Hovering over the Objects output parameter shows us that we have 31 surfaces that represent each of the floor plates in our model.
Next, we need to group each of these floor plates using the Building ID as our grouping criteria. Let’s use the Group Content component (found under the Rhino tab and Content subcategory) and connect the output of the query component to the Content input.
This component uses the Key input to determine how to group content into different data tree branches. When you right-click on the Key input, you will be presented with a few options.
Select Type - In this drop-down you can select what type of data you want to split into different groups. In this case, we want to group all of the surfaces which represent Floors, so we can select Model Object from the drop down menu since these floors are objects in our Rhino model. Select Property/Key - Depending on the drop-down menu selection above, the tree-view control will display a list of available properties or keys that you can use as the filtering criteria. Here, we want to find the User Text node in the tree view control and click on the “plus” icon next to it to expand all of its child nodes. We want to group the surfaces based on their Building ID value, so select that child node in the tree.Looking at the Content output, all of the floors have now been separated into different branches according to the Building ID number. The Values output returns a list of all the unique key values that it found in the content. In this case we see a list of three values (1, 2, and 3) which correspond to the unique ID values that were found in the list of content as well as the data tree branches of the grouped content.

The last step in this process is to add up all the area on each branch of our data tree. Since all of our floor surfaces are now separated into different branches, it’s quite easy to pass the output of the Group Content component into an Area component and then add all of those values together using a Mass Addition component.

From the Grasshopper definition above, we can determine that:
- Building 1 = 43,622 sf
- Building 2 = 36,626 sf
- Building 3 = 5,736 sf
The beauty of this workflow is how easy it is to change the grouping criteria. For example, let’s say that you wanted to determine the total square footage of the different usage types (Residential, Office, Commercial, etc.) rather than simply the total square footage of each building. In this scenario, we simply need to change the Key property to “Use Type”. Everything else can stay the same.

By switching the grouping criteria to “Use Type”, the sum total square footage is as follows:
- Commercial = 21,740 sf
- Educational = 5,736 sf
- Mixed Use = 11,326 sf
- Office = 23,972 sf
- Residential = 23,210 sf
Filtering Content
In addition to grouping, we also can filter content based on whether a certain condition is met. Typically, a filtering condition will compare one object property to another and return a boolean value (True or False). Think, is x equal to y? Or is x greater than or equal to y? We can also combine those rules into more complex expressions using operators.
So, let’s take our existing model and create a series of filters which will separate the floor plates according to the following criteria:
- Use Type must be of type “Office” AND
- The floor area must be larger than 2,250 sqft AND
- The floor area must also be smaller than 2,500 sqft
Let’s start by creating a new Grasshopper definition. In the Grasshopper file menu, click on File -> New Document. Just like in the previous example, let’s use the Query Model Objects component with the Layer filter set to “Floors” to reference all of the floor surfaces into our Grasshopper document. The output should contain 31 surfaces that represent each of the floor plates in our model.
Next, let’s create a filter which defines our first condition above - filter all floor plates whose use type equals the “Office” type. Under the Rhino tab and Content subcategory, there are a number of different filters available to us, several of which can check for equality. However, for this tutorial, let’s start by adding a Match Text Filter component onto our canvas.
The Match Text Filter is an incredibly powerful and flexible component for text comparisons. In this filter we want to go through each floor plate and extract the value assigned to the “Use Type” user text entry. We will then compare that value to see if it matches the word “Office” and filter the objects accordingly.
The Match Text Filter has three modes by which it can operate. If you right-click on the middle of the Match Text Filter component, you will see a list of three modes:

In this example, we are only interested in text values that Equal the word “Office”. So, let’s select the Equals mode in the right-click menu of the Match Text Filter.
Next, we need to specify the Key input to determine how to filter the content. Again, just like in the previous example, we can right-click on the Key input and select “Model Object” from the drop-down menu and the select “User Text” and then “Use Type” from the tree-view control.
The last step is to define the Pattern input of the Match Text Filter to define what text value we will be comparing against. For this example, we want to check if the Use Type value equals the word “Office”. Let’s add a text panel with that word and connect it to the Pattern input.
Now, that we have created a filter, we need to add a Filter Content component onto our canvas to perform the actual filtering action. The content that we want to filter are the 31 BREPs that are returned from the Query Model Objects component. And, the filter we want to use is the one we just created using the Match Text Filter.

Looking at the output, we now have only 10 surfaces which matched our filtering criteria (i.e. those floors plates which correspond to the “Office” use type). However, we aren’t quite done. We also wanted to filter the floor plates based on which ones area were larger than 2,250 but less than 2,500 sqft.
Let’s add a Greater Than Filter component and place it underneath our Match Text Filter component. Just as before, we need to set the Key input to define what value we want to compare in this filter. In this case, we want to set the Key to look at the Area user text value. So, right-click on the Key input and select “User Text” and then “Area” from the tree-view control.

Next, we need to define a numeric value to compare our area value to. Let’s add a Numeric Slider (found under the Params tab and Input subcategory) and set the value to 2,250. You may set the minimum and maximum of this slider to whatever you want, but I have chosen values of 2,000 and 2,500 respectively.
We’ve now created a filter which checks for floor plates that are larger than 2,250 sqft. Let’s create another one which looks for floor plates that are smaller than 2,500 sqft.
Add a Smaller Than Filter component beneath the Greater Than Filter we just created. Set the Key input to the Area user text value. Select the slider we just created and Copy/Paste another one onto our canvas. Set the value of this new slider to 2,500 and connect its output to the Value input of the Smaller Than Filter.
We now have three filters in our definition which match the criteria we defined above. However, we need to combine these together so that all three filters have to be true in order for the content to be filtered correctly. To do this, let’s use the Intersection Filter component.
The Intersection Filter let’s you combine multiple filters together and will return TRUE only if all input filters evaluate to TRUE. Holding the SHIFT key down, connect the output of our three filters into the Filters input of the Intersection Filter.
Lastly, replace the Match Text Filter that is connected to the Filter input of the Filter Content component with the output of the Intersection Filter. Your definition should look like the image below.

You’ll notice that we now only have 5 BREPs that are returned from the Filter Content component. These are the 5 floor plates that match the “Office” use type and are also larger than 2,250 sqft but less than 2,500 sqft.

Try It
- Download and open the GroupingAndFiltering.3dm Rhino file and the GroupingAndFiltering.gh Grasshopper definition.
- For more information about these components, check out our Discourse Post.
Learn More
Watch our Discover Grasshopper Data Types video or visit our What’s New in Rhino 8 page for an overview of these features.
Learn how to use other Data Type components in the following guides:
Object Attributes in Grasshopper
Learn how to import and/or bake object attributes, such as object name, layer or color using Grasshopper.
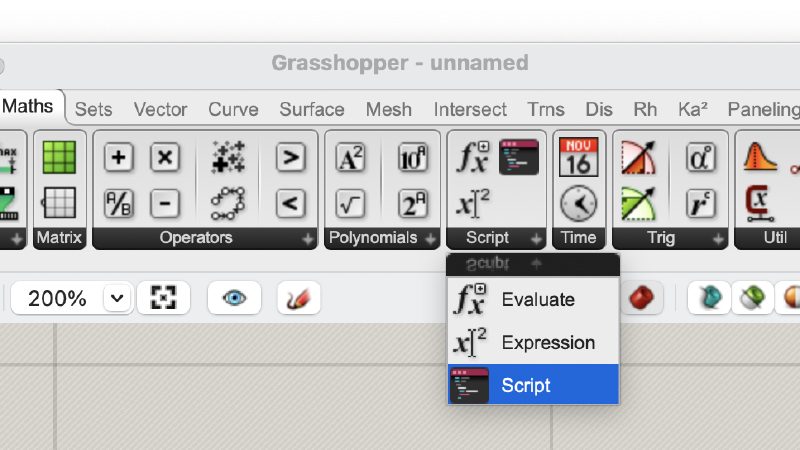
Using the Script Component
Learn how to use the Script Component in Grasshopper. Designed to work with all supported languages, it regroups the behavior of the legacy GHPython and C# components.
